It can be if you know how to calculate the financial impact and develop mitigating strategies… here’s how:
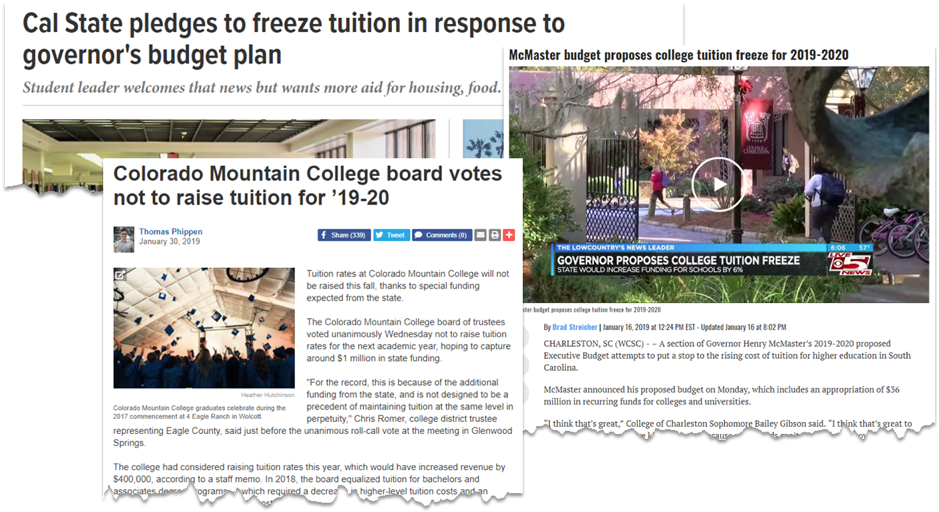
“Tuition Freeze” seems to be a headline that’s popping up more and more in higher education news sites in the US. A growing number of institutions are proposing a tuition freeze for 2019-2020, some have had a tuition freeze in place for a number of years now, whilst some institutions are even looking at tuition reduction.
The latest Association of Governing Boards 2018 Trustee Index Report states that affordability is a primary concern of Trustees, particularly as it relates to the public perception of higher education. Another major concern is the financial sustainability of their institutions.
So how do you balance a tuition freeze with long-term financial sustainability? How do you know what the overall financial impact is going to be on the institution?
The general theory seems to be that if you freeze tuition, this will make the institution more competitive and it should attract more students, which seems like a reasonable argument, particularly if everyone else is raising tuition.
It’s pretty easy to determine the overall financial impact after the event. However, it would be much better to determine this before making the decision to freeze tuition and then work out mitigating strategies to counter the negative impact.
A simple way to forecast the financial impact would be to multiply the new revenue by the estimated increase in student numbers and compare this to the total budgeted expense for the coming year. You may need to adjust the expense up by a guessed amount to cover for the extra resources required to support the proposed increase in students. If you wanted to calculate the impact for individual schools, you could simply divide revenue by Student FTE per School and divide budgeted expenses by staff FTE per school.
Of course the devil is in the detail. What if the increase in students is in a program, or worse, programs, that make a big loss? How do you know which programs are making losses and which ones have a positive contribution margin? How much should you increase expenses by to cover for this increase in students?
By not knowing the detail, any high level financial analysis as described above could lead you down the wrong path and the situation could be a lot worse than anticipated. And when you do finally calculate the financial impact a year or two down the track, you won’t know specifically which programs contributed positively or negatively to your resulting financial position.
Compounding this even further is the fact that there can often be a disconnect between where tuition revenue is earned versus where a large component of the expenses are incurred in providing the actual teaching, especially in the US where the students are often undertaking a ‘general education’ year of study for the first year regardless of their degree. This makes it very difficult to make any decisions about the future of your tuition fees, whether it be to increase, decrease or freeze them.
So how could you approach this issue? To highlight the possibilities, we will use our predictive model to run a number of scenarios and compare them to each other. The predictive model we will use here is a demonstration model and is representative of an amalgam of actual university models.
As an introduction, the predictive model represents a mid-level university with about 30,000 students and around $370 million in revenue. It is a teaching and research institution, so there is quite a bit of teaching revenue subsidizing internal research. Most importantly it has every program delivered and every unit (subject) taught which includes the ‘when, where and how’ each unit was offered. As an example CSC1001: Computer Science – Campus A, Semester 2, Classroom. Every individual program and unit instance are connected in the model so that this complex relationship is modelled in detail.
The model represents an entire institution and not just the direct teaching component and it starts its calculations from the demand side i.e. starting with how many students need to be taught in which units based on their program enrolment. The model will then calculate the amount of teaching resources required, the amount of direct support staff, it will consider how much time will flow into research and then calculate the school and institution overhead taking into account all support from HR, Finance, Facilities, and IT etc.
So the calculations are quite complex, however, once built, using the model is very simple. So let’s take a look at this situation.
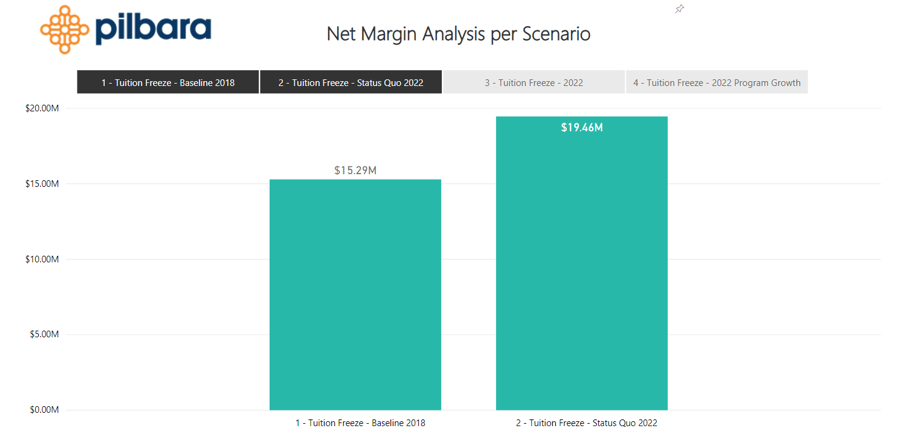
We’ll start with our 2018 baseline model as shown below, this is the model as represented in the ACE modelling engine.
We can see that 2018 has a positive margin of $15m, not great but still positive. We can then use the predictive model to forecast the financial impact five years into the future. One of the major benefits of the predictive model is that there is no need to model every year, particularly if you just want to run some quick checks into the future. Once you have completed these quick checks then each year can be carefully modelled to provide detailed financial input to your strategic plan and to test various long-range assumptions.
So the first scenario we will run is Status Quo – we aren’t going to change anything in the model. It will have the same student numbers year-on-year, and we’ll simply change the year of the model to 2022.
In the chart above we see that the margin has increased by not doing anything. This is primarily because the inflation factors set in the model for teaching revenue are higher than inflation factors set for expenses. These can all be amended individually for individual years, but for the purposes of this exercise all we want to do is get a baseline for comparison for the year 2022.
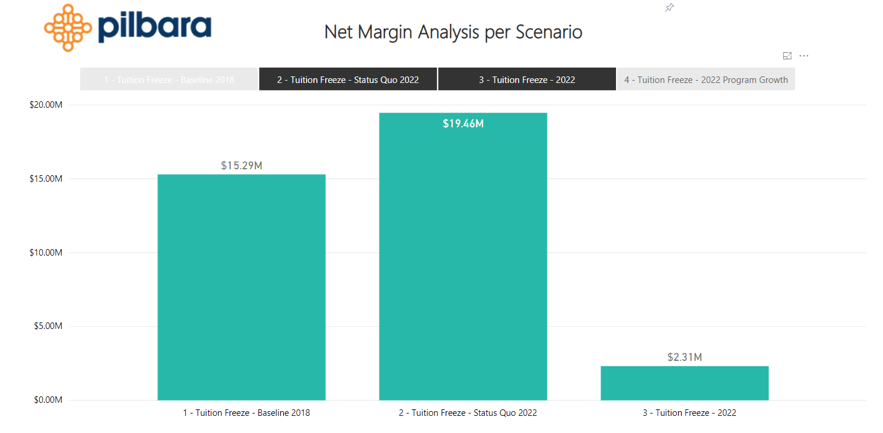
The next step, of course, is to freeze tuition and see what impact that will have in 2022.
As expected, the margin drops significantly. This scenario also takes into consideration a 5% increase in students (about 1,500) due to the tuition freeze. We haven’t even considered any reduction in students, particularly international students. (Actually I did model this out of curiosity and a small reduction in international students takes the entire institution into negative margin territory, but we can explore that whole scenario in a different blog post).
This increase in students was evenly spread across every school and program, no specific targeting at all. So what if we could target specific programs? Could we take a look at which programs provide the highest margins and target them specifically?
Let’s take a look at the model and this time, we’ll focus on the total revenue, expense and margin of individual programs.
In the screenshot above we are looking at all programs in Campus A (The biggest campus in our demo predictive model) and we have sorted the programs from highest margin to lowest margin.
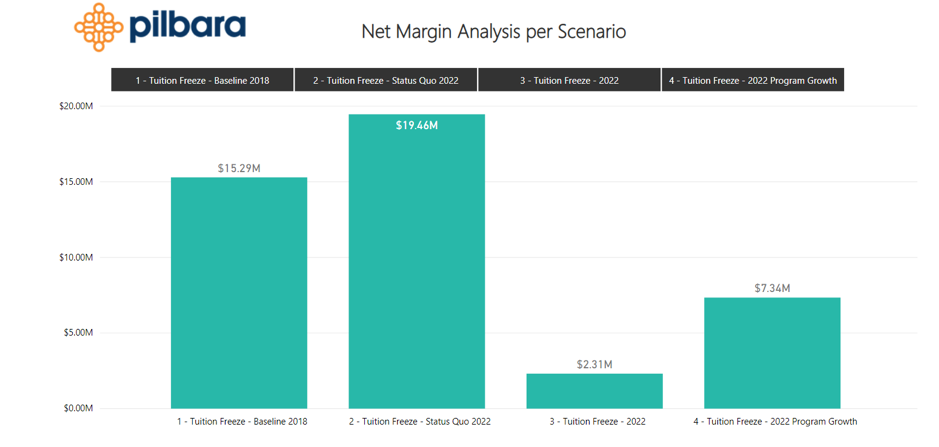
As an example, we’ll focus on just the top two, Bachelor of Science (Nursing) and Bachelor of Science (Exercise and Sports Science). Both have really healthy margins, so we will increase both of these programs over the next five years and see what impact that will have. In the model I have arbitrarily increased both by 50%. This equates to about an extra 530 students in Nursing over five year and an extra 370 students in Exercise and Sports Sciences over five years.
This increases our margins by $5 million, which is a nice increase considering that this was based on focusing on just two programs. The next logical step would be to go through all programs and determine which programs should be targeted for growth, for maintenance, and if necessary, to be phased out.
Now as mentioned previously the model will calculate all of the corresponding increases in expenses as well, not just the revenue based on increased students, so the margin for 2022 takes this into consideration.
Now with a tuition freeze the institution would probably want to look at a corresponding budget freeze as well, so as another scenario example we could look at the service areas in this particular model. This covers administrative overhead areas such as finance, HR, IT, Facilities, Marketing etc. Freezing budgets in these areas would add an extra $8 million to the margin taking it to $15 million.
Of course, this is all very easy to model, not so easy to undertake in reality. The major benefit of such an exercise is that by being able to easily model this five years or even ten years into the future, you can start to make budgeting decisions well in advance. One example of this is being able to make long term hiring plans like letting natural attrition reduce staffing numbers rather than having to remove twenty people due to an urgent financial crisis. And as demonstrated, you can focus on growing particular programs over time, knowing that while there may be some short term pain, there should be a longer term gain.


