Using the Pilbara predictive model to test crisis management options for university leadership.
By Lea Patterson, Michelle Brooke, Andrew Faulkner and Professor Alan Pettigrew BSc (Hons) PhD FAICD
Preface
This article has taken a little longer to write than usual because we have been busy running a wide range of different scenarios. Rather than creating an article based on our opinion, we wanted to test a number of our assumptions in the model to see whether they worked or didn’t work. The following scenarios and article represent the end result of this current analysis process.
Introduction
In the last article, we explored the high level impact of the COVID-19 crisis on Higher Educational institutions and considerations university leadership should take in relation to teaching, research and professional staffing. We also used the predictive model to explore a few scenarios, namely:
- reducing international student numbers by 30%
- including additional expenses for moving courses online
- including additional expenses to financially support international students already in country
- reducing expenses for contractors and capital expenditure
- removing low enrolment low margin courses, and
- increasing class sizes
In this article we’ll take a deeper dive into the 2020 year, comparing Semester 1 to Semester 2 and exploring the impact of rapidly moving classes online. We’ll also start looking at more dire forecasts for Semester 2 for international students. For example, what are the consequences if only 5% of the students expected to commence in Semester 2 actually enroll and stay for the whole semester?
Rapid Migration to Online Classes = Large Academic Workload Burden
This crisis has seen a huge amount of work performed by academic staff to move the majority of their courses online, whether via an existing platform they already had, or starting from scratch and creating videos, content and running Microsoft Teams or Zoom classes. This has increased academic workload significantly at the beginning of the year but our models suggest that this workload might not ease up and could potentially worsen.
We have reviewed a number of models for universities with mature online programs. In a mature online course the amount of hours an academic spends delivering lectures/seminars reduces significantly, down to zero for courses where all of the content is recorded. (It should be noted that although delivery time is usually zero, there is still a significant amount of time spent administering the course). But the amount of time spent supporting students increases by about 30% per student. For institutions that have had to create online content and/or run remote lectures via Teams/Zoom, which is more of a “lift and shift” of existing content rather than creating specific online content, the situation is far less favourable. This strategy means the lecture hours won’t reduce as much (or could stay the same) but the level of effort per student will very likely increase in this new online delivery mode. This could also be exacerbated by academic, professional support staff and students having to learn new technology, thereby adding more time to the new education model.
So this rapid move to online teaching has increased the workload burden on academic staff (and supporting professional staff) in the immediate term but could also burden staff over the longer term depending on how long institutions are required to keep classrooms closed. This scenario provides a double whammy of exhausted staff and financial pain for the institution. And added to that is the impact on time spent on research, even when there is no other constraint on that activity (e.g. access to laboratories). It is not inconceivable that alleviating the new teaching burden on staff may actually require an increase in Sessional staff rather than a reduction.
Scenarios 7 & 8 (Semester 1 and Semester 2)
For these scenarios we pick up from the last piece of analysis, after dropping International Students by 30%, removing 50% of contractor fees and removing a large capital project. Further to this we have removed most of the revenue associated with Commercial Services, since most campuses are very quiet at the moment.
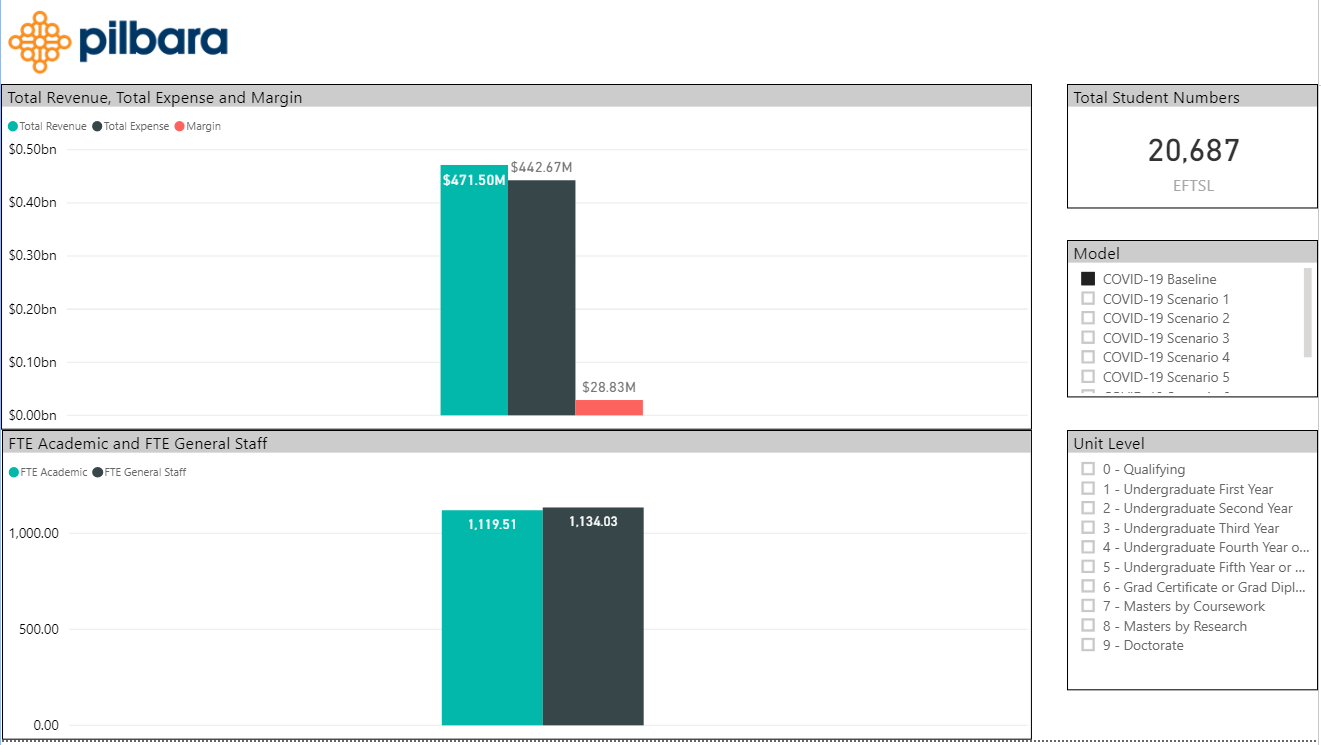
Let’s remind ourselves of the baseline position of the University:
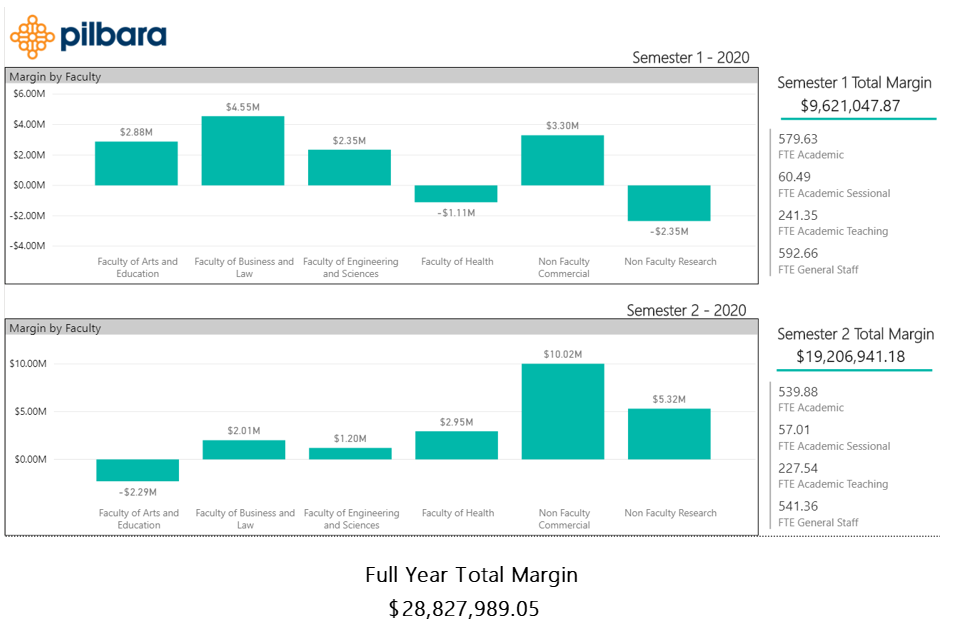
On a per faculty per semester basis in the baseline model, the picture looks like this:
In our new scenario, the following variations are applied to the baseline model:
As per our previous article:
- Semester 1 international student numbers are reduced by 30%
- Contractor expenses are reduced by 50%
- A large capital works project is removed
And in addition:
- Only 5% of the expected international students commence study in semester 2
- Commercial activity on campus is reduced across both semesters by 60%
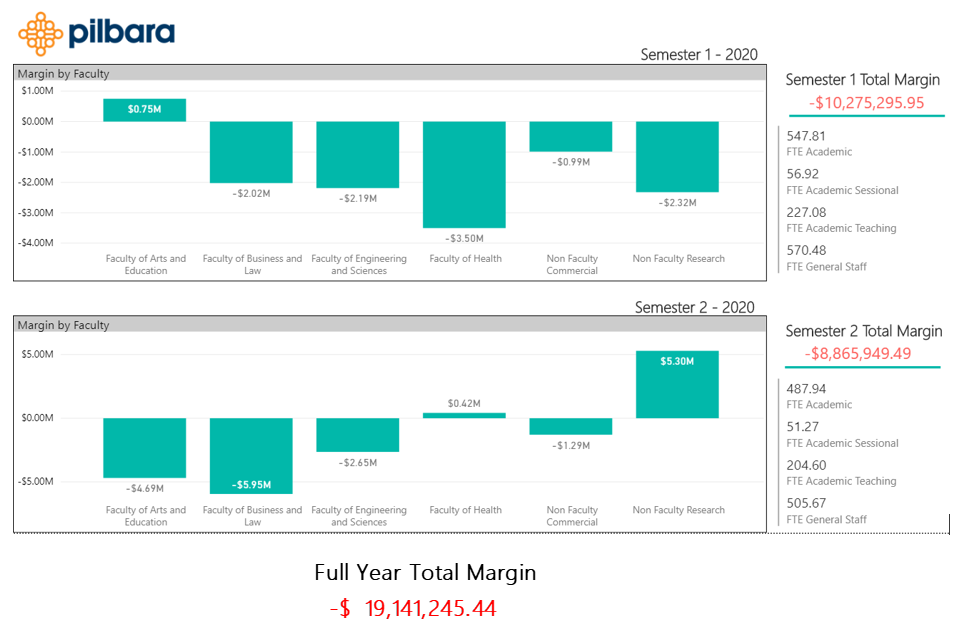
Not a pretty picture but you can start to see the variation in the impact on faculties resulting from the drop in their respective international cohorts.
It’s also important to note that these margins are based on the model calculating the “required” academic and general staff to support the reduced teaching load. The actual financial position will be worse, but we want to explore other options first before manipulating staffing numbers in the model. So, at this point we are including the potential savings from a reduced workforce due to a reduced workload stemming from the reduced student numbers. But as we can see in the next scenario, that workload is about to be picked back up again by the increased effort in teaching online.
Scenarios 9 and 10 – Online Profiles
What do we mean by online profiles? In both the historic and predictive models, we define the workload required for every course taught at the university. This covers time for administration, teaching, student support, marking and assessment etc. These profiles vary by course, school and delivery method. In the following scenario we will model the impact of changing from classroom to online teaching. As mentioned previously a mature online program would typically have ‘zero’ hours for teaching but 30% increase in hours per student support.
For this scenario we will also assume a “lift and shift” so teaching has simply moved from classroom to Microsoft Teams or Zoom but with the addition of an increase in per student support (think of all the email enquiries from individual students that have to be answered as opposed to a pre-COVID tutorial environment). Let’s assume that lecture times are the same and there is a 30% increase per student support. We can go down to individual courses and change these profiles, or for the sake of this demonstration we can set an average for all of them. The objective at this stage is to show the university wide impact, rather than on a course by course basis, to make it easier to see the overall impact on the bottom line.
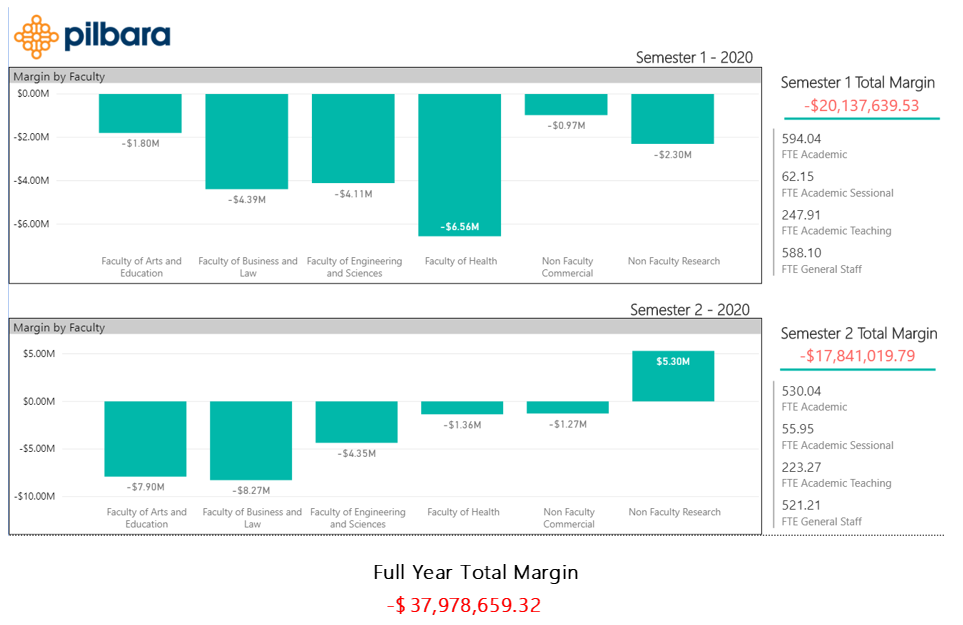
This paints an even worse financial picture mainly because the academic workload has increased back to similar FTE numbers as the baseline model but with far less revenue. This means the reduction in workload due to the loss of international students has been offset by the increase in workload by moving teaching online.
The big challenge facing institutions now is how to sustain the new recently established teaching models whilst providing opportunities to resume reasonable if not normal levels of research activity.
Academic Resourcing
As discussed in great detail in William Massy’s (Professor Emeritus of Education and Business Administration and former Vice President and Vice Provost at Stanford University) latest book Resource Management for Colleges and Universities – the key to successful and sustainable higher education is effective resource allocation in support of teaching, research and essential support services. This book was written before the current pandemic and “status-quo” was a major barrier to implementing these types of “Academic Resourcing Models”, but now the COVID-19 pandemic has provided that “burning platform” for change.
So what can an institution do now to deploy resources effectively to address the current crisis but also prepare for the post-crisis world?
Staff are the biggest expense at a university, so it is essential to understand what everyone does in the institution. On the academic side this specifically means understanding who teaches which courses, how much time is spent outside of teaching on commercial, community support and the big one, research. On the general staff side this means reviewing support roles and whether general staff could be redeployed to support the institution in other ways during the crisis.
Academic and General Staffing Levels
To ensure a financially sustainably position there is no doubt this will require a reduction in personnel. The questions are how many, what category and from which organizational unit are staff positions reduced. The model has been used to run a large number of different scenarios looking for a balance of personnel to support the operations and mission of the institution but also ensuring this is done in a financially responsible way.
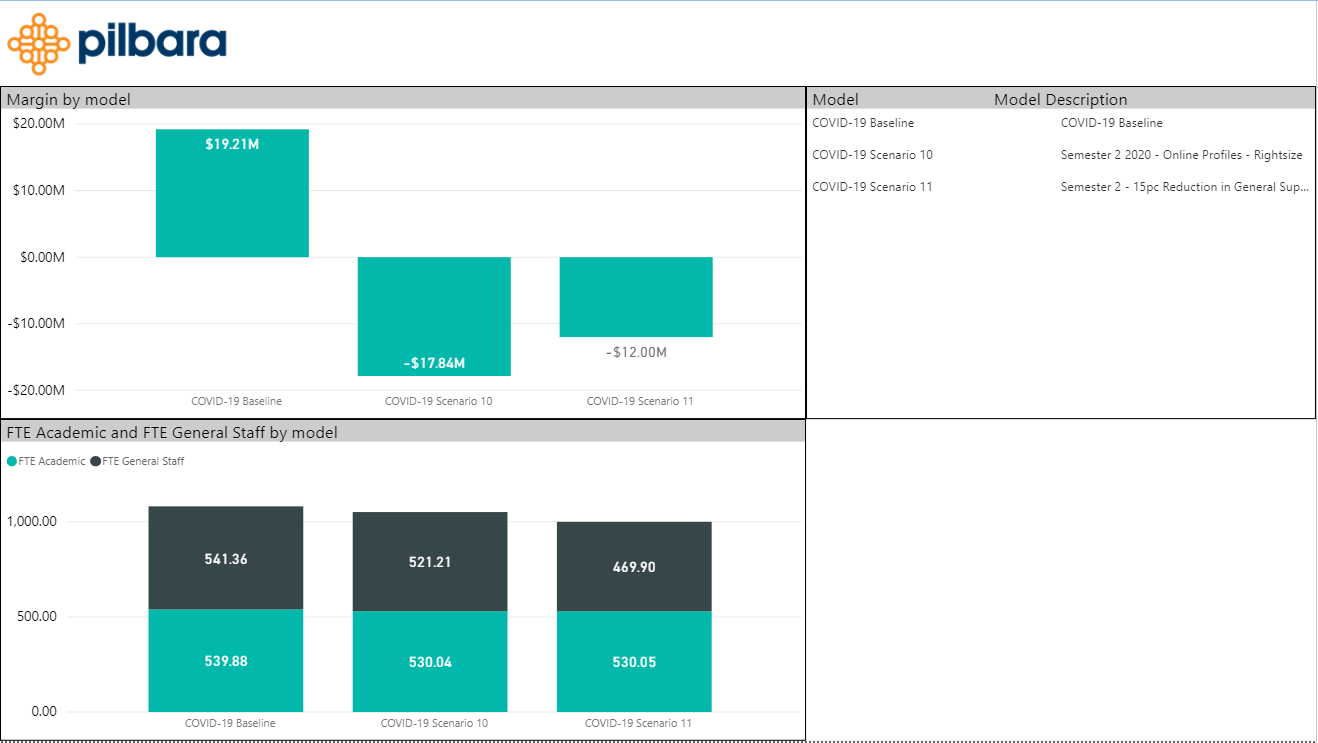
Scenario 10 above shows an increased academic workload is required to support the teaching load due to the additional effort in rapidly moving and maintaining all courses online. This brings the FTE numbers to about the same level as the baseline model but with far less revenue. This then results in a large projected loss for Semester 2 of $17.8 million. As mentioned previously improving this margin means reducing staff levels.
Scenario 11 – General Staff Support
A number of options for General Staff reduction were explored and finally settled on a 15% reduction (about 72 FTE) from the support areas of the institution, which results in a slightly better financial position.
Scenario 12 – Teaching Load and Research Adjustments
The reduction in general staff did improve the margins a little, so now we must review academic staff positions. As shown in previous scenarios, the reduction in international students resulted in a calculated reduction in academic FTE required to support the reduced teaching load. However, the increase in effort to move all courses online and support students online resulted in a calculated increase in academic FTE. This is not financially sustainable, given that the academic FTE is virtually the same as the baseline model but the revenue has dropped significantly.
To bring the margin back into positive territory requires a reduction in academic FTE while still supporting the increased workload brought about by moving online. This means each academic would be required to allocate more time to teaching and less time to research, which is where we start to explore academic workload profiles.
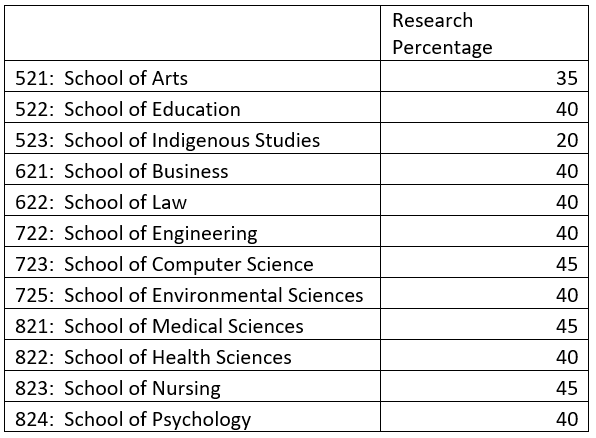
The generally accepted workload profile in a research-based university is 40:40:20; that is the ratio of an academic’s time split between teaching, research and community support/commercial activities/administration. The ratio varies by institution, school (depending on the applicable industrial relations arrangements) and often down to each academic, but our analysis of ratios across a range of disciplines across several institutions has been the basis for the data currently held in the model, shown below:
As can be seen above, research can take up a significant portion of an academics time, however research is also vitally important to support advances in science, medicine, arts etc. So it’s important to ensure the reduction in research time is kept to a minimum.
Our modelling has indicated that we need to reduce the academic workforce by about 100 FTE to return to a positive margin. If we do that, what does it do to the academic workload requirements? The modelling shows that teaching effort per FTE will need to increase by 10% to support the increase in workload with fewer academics, which will then reduce their available research time by 10%.
The model can now be run with a 10% reduction in research time for all schools initially to see what the impact is. This excludes full-time research staff time and externally funded research projects. Although this reduction is being applied equally to all schools, it would likely be even more helpful if workload distributions were generally more flexible across the institution.
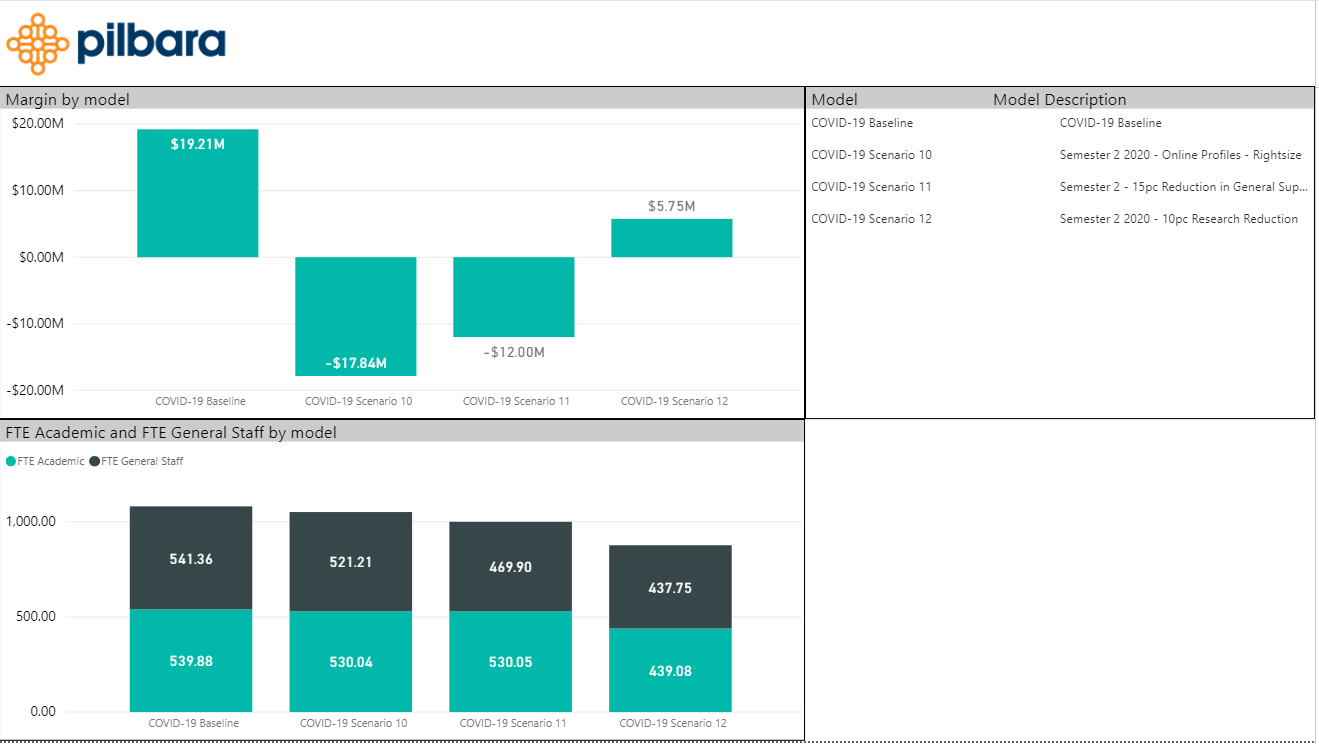
The result is dramatic, all four scenarios are compared below for Semester 2 – Baseline, Scenario 10, Scenario 11 and Scenario 12.
The Semester 2 margin has changed from -$17.8 million in Scenario 10 to a positive $5.8 million in Scenario 12. So why the large margin swing? It’s all about the staff numbers, as the model is calculating that the university could support the same teaching load with 19% fewer academic staff if they spent less time on research.
The calculations in all these Scenarios are based on a large amount of data held against every single course in the model including time for:
- Teaching
- Preparation
- Student Support
- Marking Exams
- Administration
This is also broken out by lectures, lab, seminar and tutorials and also allows for repeats. It’s driven by the teaching load (number of students, class sizes, number of classes), so it’s quite a robust calculation.
Tough Choices
The scenario above predicts that restoring a reasonably healthy positive financial outcome for the university could be achieved by a 19% reduction of 101 Academic FTE and 104 General FTE. To achieve this and still perform all of the required teaching, the research time of the remaining academic staff will likely reduce by 10% as teaching takes up more of their time. However, the size of the margin allows management to review staffing across all schools in the context of both teaching loads and research outcomes and priorities to determine the most appropriate areas where staff numbers might be reduced and where staff should be retained to support important/well performing research projects.
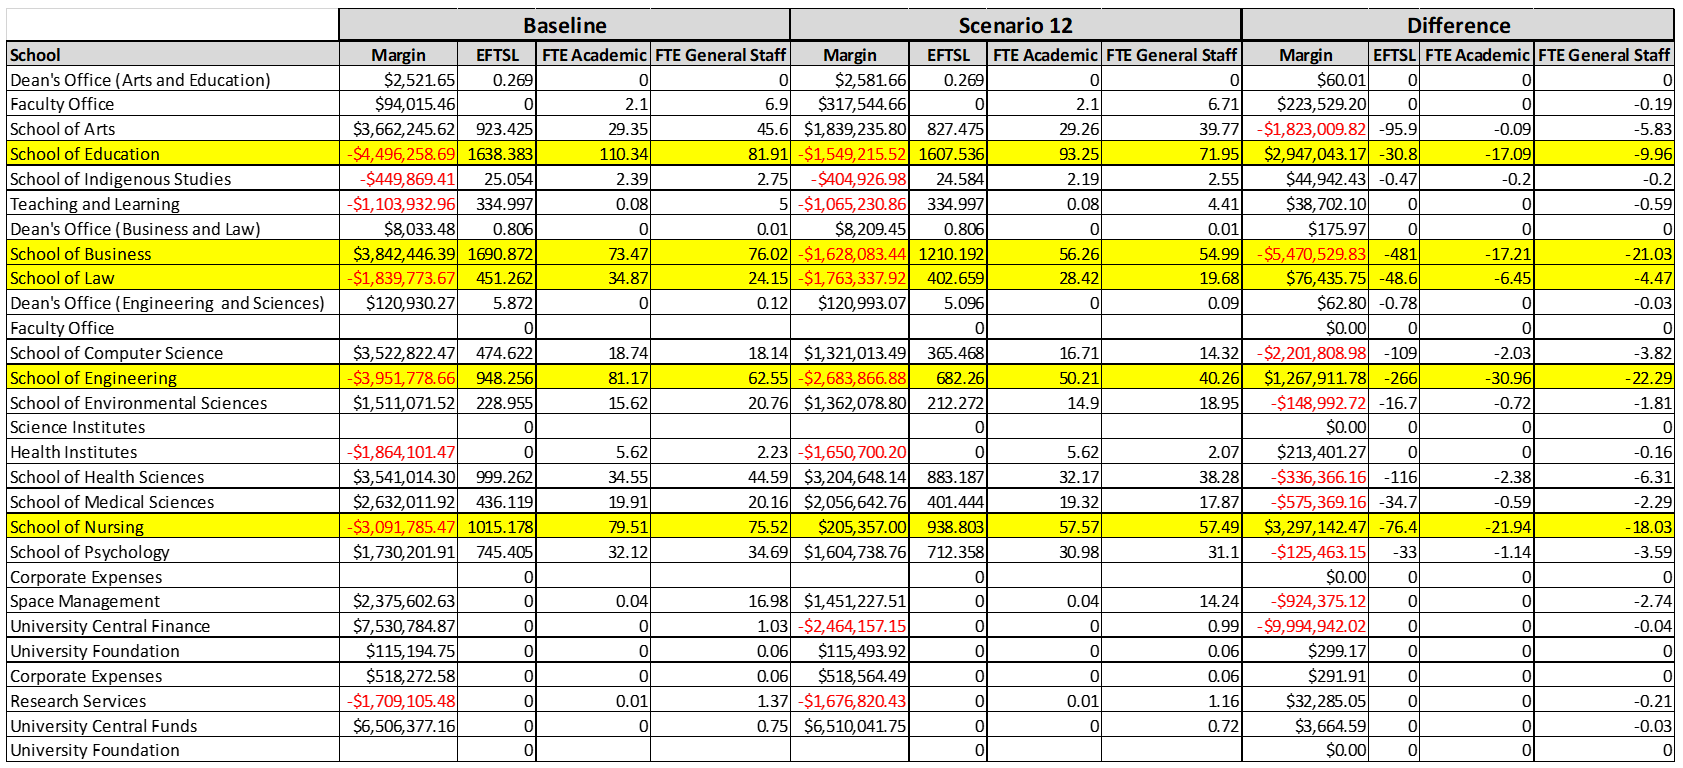
Comparing this Scenario 12 to the Baseline model
There are five schools highlighted with the largest predicted drop in staff numbers:
It’s interesting to note that all of the schools except Business were originally losing money in the baseline model and all except for the School of Business have now improved their margins (as the School of Business was the hardest hit due to the reduction in international students).
This is simply the start of the analysis and decision-making process. Using the model allows university leadership to quickly run a wide range of scenarios to determine whether they are worth pursuing or ignoring. This example shows five schools that can be examined in much greater detail to work through the staffing levels, research priorities and financial performance. Adjustments away from the modelled numbers for whatever reason will, however, require changes in the other schools where the initial predicted loss of staff is much less. Such variations can easily be included in the model so that the impacts of variations can be ascertained and judgements made as to their likely contribution to the sustainability of the affected schools and the institution as a whole.
Other Options – Course and Program Analysis
We have also written about the benefits of using these types of models to support course and program analysis to identify candidate programs for investment or disinvestment and whether courses can be consolidated, conserved or cut.
This is all part of the vast management challenge of ensuring high quality teaching and research in a financially sustainable way by efficiently allocating resources to the core activities of the institution, in the midst of a global pandemic
A final comment and disclaimer
The results of the modelling exemplified here are based on assumptions about a future that is unknown, especially regarding commencing enrolments in Semester 2 (both international and domestic fee paying). However, changes to the assumptions based on emerging indicators can be made to the model at will, thereby providing a higher level of comfort to the many difficult management decisions that have to be taken.
The biggest challenge is yet to come – what will the situation look like in 2021, and beyond. In a future blog we will examine some potential scenarios to give an indicator of the potential outcomes and challenges for which institutions need to prepare.
 Professor Alan Pettigrew BSc (Hons) PhD FAICD
Professor Pettigrew has held senior academic and executive appointments at the Universities of Sydney, Queensland, and New South Wales. He was Vice-Chancellor and CEO of the University of New England from 2006 to 2009. From 2001 to 2005 Professor Pettigrew was the inaugural CEO of the National Health and Medical Research Council (NHMRC) of Australia.
Professor Pettigrew has served on many Australian Government and other committees and he was an adviser to the Chief Scientist of Australia (2010-2014). He has actively contributed to national policy discussions on research and higher education. Professor Pettigrew was a Professorial Fellow of the L.H. Martin Institute at the University of Melbourne from 2010 to 2018 and has served as a consultant on international higher education and research training projects supported by the World Bank, the OECD and the Swedish International Development Agency. He has been engaged as a consultant by the NHMRC and the Australian Research Council as well as by eleven Australian universities advising on leadership, management and research strategy.
Professor Pettigrew was Chair of the Board of the Illawarra Health and Medical Research Institute from 2014-2020. He has been a member of the Council of the QIMRBerghofer Medical Research Institute in Brisbane, Queensland since 2011 and is Chair of the Appointments and Promotions Committee at the Institute. He has served as a Special Adviser to the Provost at the University of Sydney for a number of projects (2016-2019) and was appointed in 2019 as an external Fellow of Senate at the University, Pro-Chancellor and Chair of the Senate’s People and Culture Committee. Professor Pettigrew is also currently a Vice-Chancellor’s Representative on Research School Reviews at the Australian National University and an Expert Advisor to the Tertiary Education Quality Standards Agency (TEQSA) of the Australian Government.
