Last week I presented at the CAM-I quarterly meeting 11-13 September 2023 in Tyson’s Corner, VA. I was thrilled to be joined by Professor Robert Kaplan (Harvard University) and Mike Mahoney (CEO E-Liability Institute) who co-presented with me and provided an overview of their E-liability methodology.
We also celebrated CAM-I’s 50th anniversary, it was great to catch up with old friends and reminisce as well as discuss the future of CAM-I and specifically, from my perspective, how we can use the extensive body of knowledge from CAM-I to support global efforts to reduce greenhouse gas emissions.
So, what did we discuss during our presentation?
The Project
CAM-I have reinvigorated the Environmental Sustainability Interest Group (ESIG), which was started over 10 years ago, but back then there was virtually no interest in these types of modelling solutions to deal with Greenhouse Gas Emissions management / reduction. Things have changed significantly in the last 12-18 months, it seems like there is a new Carbon Accounting solution on the market every second day! We are also excited to announce that we are working with the E-Liability Institute and have started a pilot model at King County (WA) – Fleet Services Division. I first came across the E-Liability Institute when I read this article in Harvard Business Review. There is a great overlap between the CAM-I ESIG Methodology and the E-Liability Methodology, specifically the use of Activity-Based Costing to allocate GHG Emissions through to individual products and services.
The Issues
The issues with the current Carbon Accounting world, is that GHG measurement is just the start of the process, what is really required is GHG reduction not just reporting. Both the CAM-I method and the E-Liability Method is focused on GHG reduction! The CAM-I methodology adds a financial dimension to the model with the objective to help organizations transition to a greener business model in a financially sustainable way! There was a report published by the International Federation of Accountants (IFAC) that stated only 24% of companies that currently report their emissions know how much it will cost to transition to zero/net zero emissions, that means there are a lot of companies that are essentially flying blind!
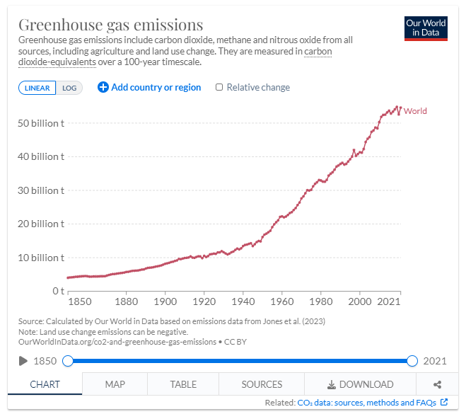
And the big issue, the current reporting requirements, that have been around for over a decade, are not working, because emissions continue to rise!
As of 2021 there were 54.59 billon tonnes of GHG emitted and it’s growing, there was a little dip during the pandemic, but it has now resumed it’s initial trajectory, which is not a good thing!
The Paris Agreement’s objective is to hold “the increase in global average temperatures to well below 2 degrees Celsius above pre-industrial levels” – ideally 1.5C. Now 1.5C or 2C doesn’t sound like a lot, in fact temperatures can swing by greater than that just in one day, this is where we get into the difference between weather and climate. Let’s take a look at two historical examples.
During the last Ice Age, the global average temperature was only 6 degrees Celsius lower than today.
During the time of the dinosaurs, when crocodiles roamed above the artic circle, the global average temperature was only 4 degrees Celsius higher than today.
So, as you can see, it only takes a small change in global average temperatures to have a massive impact on the planet!
Problems with Current Reporting
As mentioned above, companies have been reporting their emissions for over a decade and we know that this hasn’t lead to a reduction in emissions. Kenneth Pucker, former COO of Timberland, stated “It turns out that reporting is not a proxy for progress.” He went on to further explain the issue “It’s as if a person committed to a diet and fanatically started counting calories, but continued to eat the same number of Twinkies and cheeseburgers.” Timberland used to add Green Index scores to their shoeboxes but stopped doing it because of the challenges in calculating these scores.
Amazon is another company that actively calculates and reports their emissions, but as Dara O’Rouke, who was a senior principle scientist at Amazon and founded its Sustainability Science and Innovation team, discovered that the carbon footprint they calculated was not fine-grained enough to actually take action on.
Laura Franceschini, a member of Google’s global sustainability strategy and operations team, discovered that the data required to properly calculate their environmental impact, is located in different places and different systems and requires many parties working together to get the right metrics. “A lot of time, there’s many different systems, they don’t talk to each other, and that amalgamation needs to happen manually…(in) Spreadsheets”
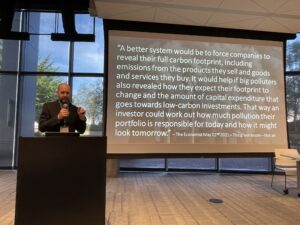
An article in the Economist Magazine stated that “A better system would be to force companies to reveal their full carbon footprint, including emissions from the products they sell and goods and services they buy.”
Solutions to these Problems
Problem: Timberland stopped labeling shoeboxes with Green Index Scores because of the challenges in calculating them.
Solution: The CAM-I ESIG methodology allocates all environmental and financial costs to individual products and services via ABC.
Problem: Amazon discovered that the data was not fine-grained enough to take action on.
Solution: The CAM-I ESIG methodology uses detailed allocations based on causes of cost (resource usage). This provides the detailed data required to identify actionable interventions.
Problem: A lot of times, there’s many different systems, they don’t talk to each other, and that amalgamation needs to happen manually…(in) Spreadsheets.
Solution: Our core methodology requires pulling data from a wide-range of disparate source systems and amalgamating them in one cohesive model.
Scope 3 is a Problem
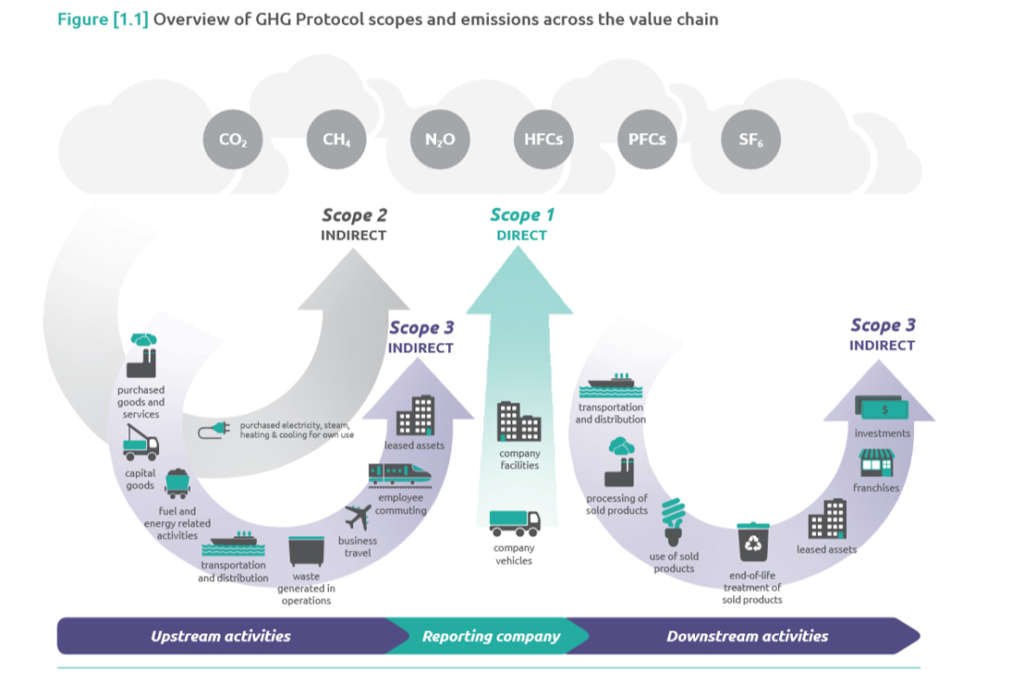
The various Scopes of emissions are defined as:
Scope 1 – these are direct emissions into the atmosphere, this includes smoke coming out of chimneys/exhaust pipes and burps/farts coming out of cows.
Scope 2 – this primarily covers energy consumed like electricity and gas and these can be measured indirectly using emissions factors.
Scope 3 – is everything else, embedded emissions in supplies purchased, travel, transportation through to end-of-life.
The big problem with calculating Scope 3 emissions is that it is based on averages and approximations and can easily be counted multiple times. What’s needed is a system that allows you to count direct Scope 1 emissions once and then pass it along the value chain to the final end consumer. This means that when you pass this onto your customer, it then becomes their Scope 3 input. They can then add any new Scope 1 they use in developing their product or service, add other suppliers Scope 3 and pass that to their customers as the new per product Scope 3 embedded emissions. This is the E-Liability Methodology. I should note that Scope 2 is really Scope 3, it just comes from an electricity or gas provider. But to ensure alignment with the current terminology I’ll continue to refer to it as Scope 2.
E-Liability
Just by way of introduction here is a quick overview of E-Liability and the Institute:
E-liability accounting principles were developed in 2021 by Professor Robert Kaplan (Harvard) and Professor Karthik Ramanna (Oxford) (won McKinsey Prize for most impactful 2021 Harvard Business Review article, reference below).
In 2022, Kaplan and Ramanna established the non-profit E-liability Institute to drive the idea into practice, with several major organizations donating time and money to get us off the ground. In 2023, we recruited and hired Mike Mahoney as CEO (20+ years of experience with C-suites and boards on driving transformational change).
Since 2022, we collaborate with faculty at Stanford’s Doerr School of Sustainability to establish accounting principles for creation and trading of carbon removal offsets (“E-assets”).
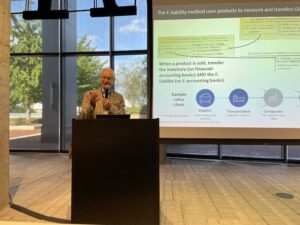
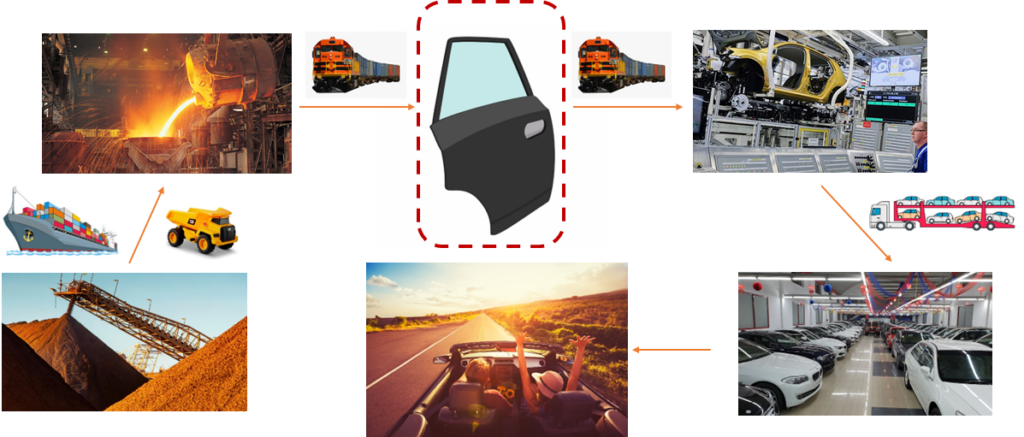
Professor Kaplan provided an overview of the E-Liability methodology using a manufacturer of car doors as an example.
Consider a producer of automotive car doors attempting to trace its supply-chain emissions, starting with raw materials extraction. For large supply chains this can be quite a complex and daunting task, but under the E-liability method, the manufacturer only has to calculate their specific Scope 1 emissions and add the embedded emissions from their suppliers. They then assign the sum of purchased and produced emissions to each output, using Activity-Based Costing to then pass to their customers.
The objective is that no matter how complex the value chain is, each entity need only know it’s direct emissions and the emissions embedded in the products purchased from immediate suppliers. And it transmits emissions via products sold to its immediate customers.
The car door manufacturer’s E-liability emissions report can be easily produced by adding up its product-level emissions data.
Companies report on the stocks and flows of their E-liabilities just as they report on inventory stocks and flows in their financial statements.
The benefit of the E-liability method is that Scope 1 emissions are calculated (and audited) once and only once, at the place where they occur, improving accuracy and lowering compliance costs. Accurate, transparent and auditable information enables companies to reduce global Scope 1 emissions by re-designing products, re-engineering processes, and purchasing low-carbon-content products and services.
E-liability carbon accounting promotes continuous decarbonization improvements across even the most complex supply chains.
Pilot Models
The E-liability institute has already started a number of pilot implementations at the following organizations:
 We have now jointly started a pilot at King County (Washington) – Fleet Services Division. King County is quite a large county with a population of around 2.2 million people and a budget of about $16 Billion. The King County Fleet Services Division manages over 3,000 vehicles and equipment for County agencies and services including the Sheriff’s Office, Parks, Roads Maintenance, Wastewater Treatment, Water and Land Resources, Facilities, Department of Adult and Juvenile Detention, Public Health, and more. The Fleet team manages the full vehicle and equipment lifecycle including initial specifications, purchases, upfitting, maintenance, warranty repair, and surplus at end of life.
The Pilot model started last week at the CAM-I quarterly meeting and the general approach taken to kick things off was to discuss:
- Objectives of Fleet Services Division
- Scope and Boundary of the model.
- Organization structure.
- Organizational outputs.
- Scope 1 and Scope 2 emissions.
- Data sources for Scope 1 and Scope 2 emissions.
- Major suppliers.
- Data for Scope 3 embedded emissions from major suppliers
- Data sources for the ABC model – Financials, HR/Payroll, Facilities Management
The primary objective is to support their plans to transition to electric vehicles, this means ensuring there will be a reduction in GHG emissions plus calculating the full cost of the transition.
Reduction not just Reporting
The overall objective of the project is to create a solution that can provide actionable data to enable an organization to transition to a greener business model in a financially sustainable way.
We know reporting is not working to reduce emissions! We want to focus on detailed internal models to support decision makers with identifying ways to reduce emissions, by tracing actual resource usage, through the processes undertaken to provide the final product/service. To reduce emissions, as mentioned above, organizations can re-design products, re-engineer processes to use less resources and also purchase lower carbon intensive supplies.
It can be overwhelming reading about all the various standards and reporting requirements, we should focus on what’s important – reducing actual emissions. I’m not here to convince you of climate change. I want to find organizations who are serious about reducing emissions and work with them to help with this transition, over time we can make a real difference!
